Machine-learned potentials are more accurate than the classical ones most people still run, and much slower. MACE is one of them. We timed it on diamond silicon, from one CPU core to 64, and once on a single GPU. More cores were not always faster, and they were never free.
What this is
QuickMDSim runs LAMMPS in the cloud. You bring an input script. You pick a machine size. You get the log and the dumps back. There is no cluster account and no queue to join. This post is a timing of one potential on those machines, not a tour of the product.
MACE is a machine-learned interatomic potential. It predicts energies and forces from the local arrangement of atoms, trained on quantum-mechanical data rather than fitted to a hand-written formula like Stillinger–Weber or Tersoff. The model here is a published general-purpose MACE, restricted to silicon. Inside LAMMPS it is evaluated by a library called Symmetrix. If you want the exact lines, they are at the bottom.
What we ran
Diamond silicon, lattice constant 5.431 Å, held at 300 K with a 1 fs timestep. Two sizes, because a small box and a larger box do not scale the same way. 512 atoms is a 4×4×4 block of conventional cells. 4,096 atoms is 8×8×8. Each run had a short warmup, then a timed stretch: 200 steps for the small box, 100 steps for the larger one.
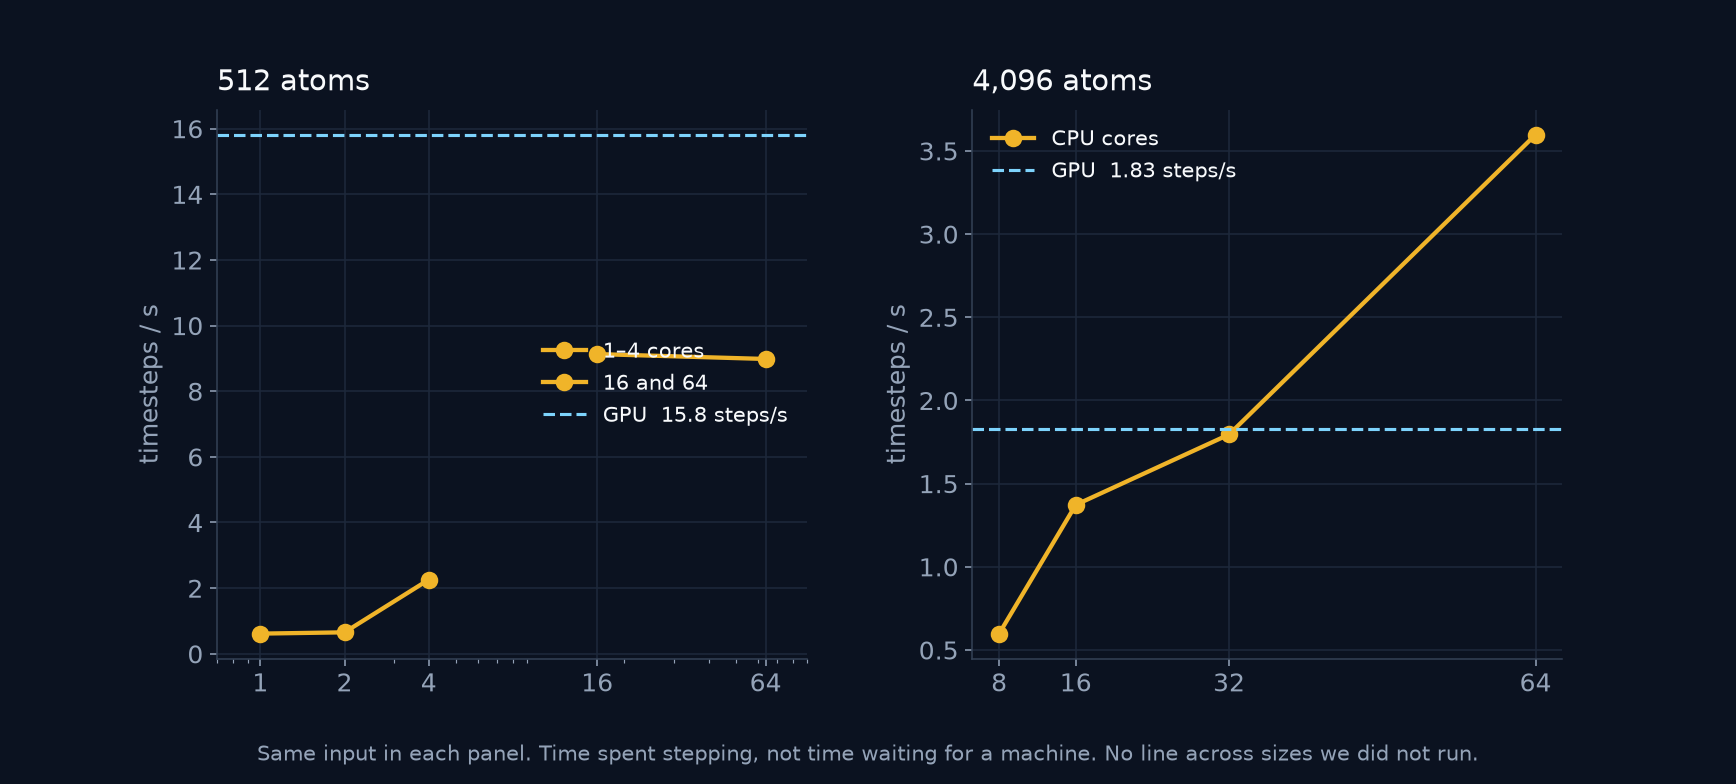
The rates below are timesteps per second while the atoms were moving. They do not include time spent waiting for a machine. We did not run 8 or 32 cores on the small box, or 1–4 cores on the large one. Those gaps are blank. They are not a flat line we forgot to draw.
One to four cores, and eight cores and up, are different machines. Do not read the left side of a chart and the right side as one scaling curve.
The small box
On 512 atoms, almost all of the timed section was the force calculation. The neighbor list was not rebuilt during those 200 steps. Even at 16 cores, cores spent under 3% of the time talking to each other.
- 1 core: 0.613 steps/s. About 3,200 microseconds per atom per step.
- 2 cores: 0.652 steps/s. Six percent faster than one core, and twice the bill.
- 4 cores: 2.257 steps/s. 3.7 times the one-core rate, not 4.
- 16 cores: 9.130 steps/s. The fastest CPU we timed at this size.
- 64 cores: 8.981 steps/s. A little slower than 16, at four times the bill.
- One L4 GPU: 15.814 steps/s. About 1.7 times the 16-core rate.
The larger box
On 4,096 atoms the force calculation was still almost the whole step. The rate kept rising through 64 cores. It did not rise eightfold.
- 8 cores: 0.598 steps/s. About 410 microseconds per atom per step.
- 16 cores: 1.372 steps/s.
- 32 cores: 1.795 steps/s.
- 64 cores: 3.597 steps/s. Six times the 8-core rate, not eight. Fastest CPU.
- One L4: 1.826 steps/s. Faster than 16 cores. Slower than 32 and 64.
What you pay for
A job is billed in CPU-hours. One hour on one core costs one CPU-hour. One hour on 64 cores costs 64. One hour on the L4 is billed as 12 CPU-hours. Divide the step rate by that factor and you get timesteps per CPU-hour: how much motion you buy for what you pay.
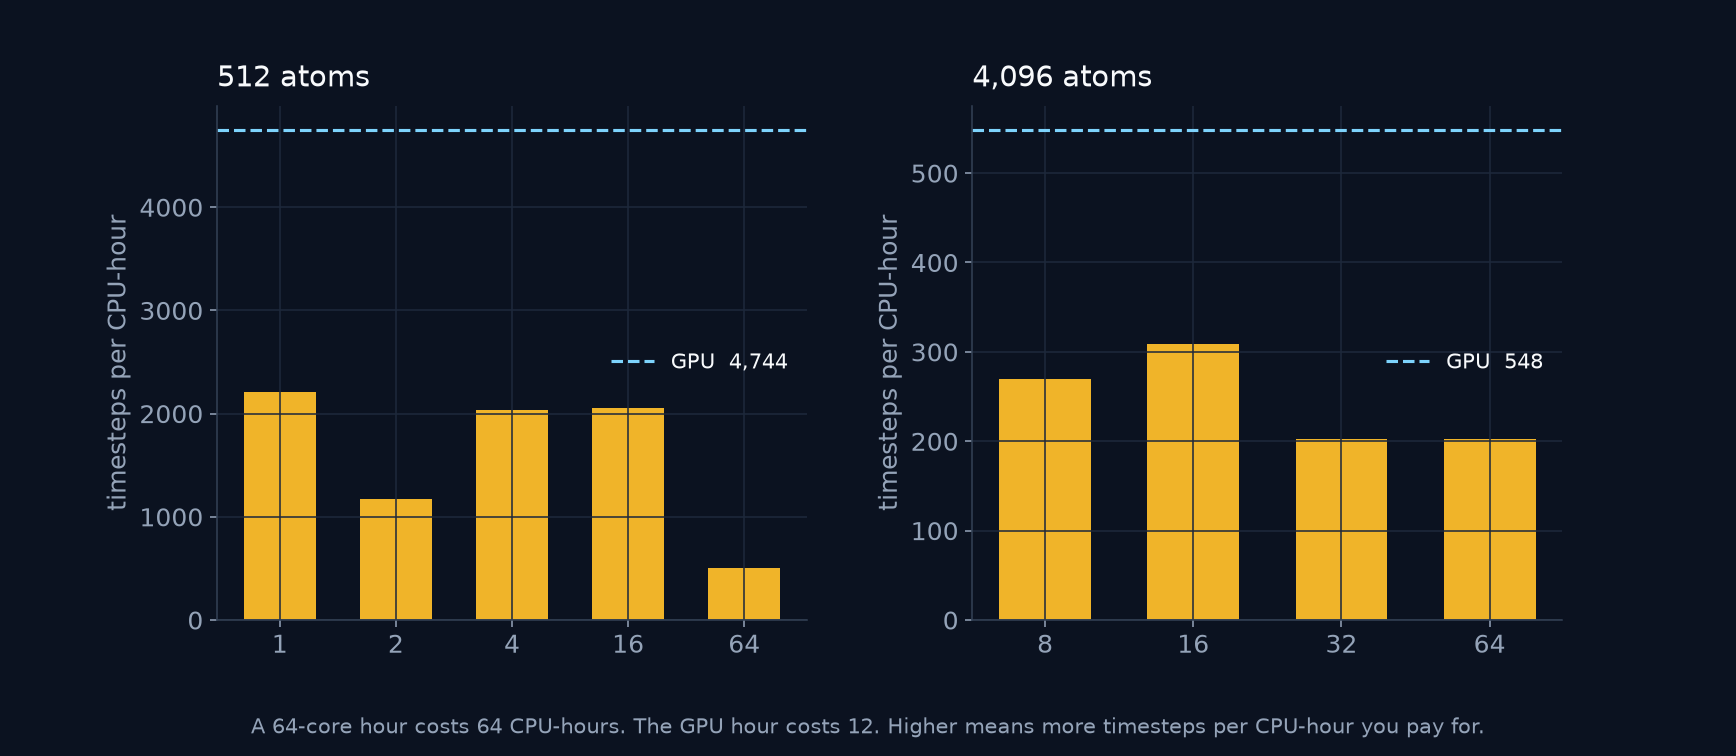
On the small box, one core and 16 cores are close: about 2,200 and 2,050 steps per CPU-hour. Two cores are worse, about 1,170, because they barely sped the run up. Sixty-four cores are about 500. The GPU is about 4,740, so on this box it is both faster and cheaper per step than any CPU size we timed.
On the larger box, 16 cores is the best CPU value, about 310 steps per CPU-hour. Thirty-two and 64 cores are both about 200. The GPU is about 550, so it is the cheap one per step, and not the fastest. Sixty-four cores finished the timed stretch in 28 seconds. The GPU took 55.
How to read this
- Small MACE run: two cores did not pay. Four cores did. Sixty-four cores did not beat 16, and cost more. The GPU beat every CPU size we timed, on time and on cost.
- Larger MACE run: the rate was still climbing at 64 cores. That was the fastest CPU. It was not the cheapest. The GPU beat 16 cores and lost to 64.
- These are step rates. We did not check that every core count produced the same trajectory, or the same forces to the last digit.
This is one machine, not a multi-node cluster. We do not promise that more cores will finish your input sooner. The numbers above are why.
On QuickMDSim, a free account can use 1 core. A paid Basic account can use up to 16. Pro can use up to 64, and the GPU. One wall-clock hour on 64 cores is 64 CPU-hours. On the small silicon script, that hour would also have been slower than 16 cores.
The input, if you want it
LAMMPS 10 September 2025. The potential is called with
pair_style symmetrix/mace
pair_coeff * * mace-si.json Si
Cite Thompson et al., Comp. Phys. Comm. 271, 108171 (2022), for LAMMPS, and Batatia et al., J. Chem. Phys. 163, 184110 (2025), for the MACE model.